Short answer: Excel has no built-in Gantt chart type. Use a free project tracker template whose week grid colours itself with conditional formatting, build a stacked bar chart, or start from one of Microsoft’s Gantt templates. To show clients progress, upload the tracker to Waypoint and share a live link instead of the file.
Free Excel project tracker with Gantt bars
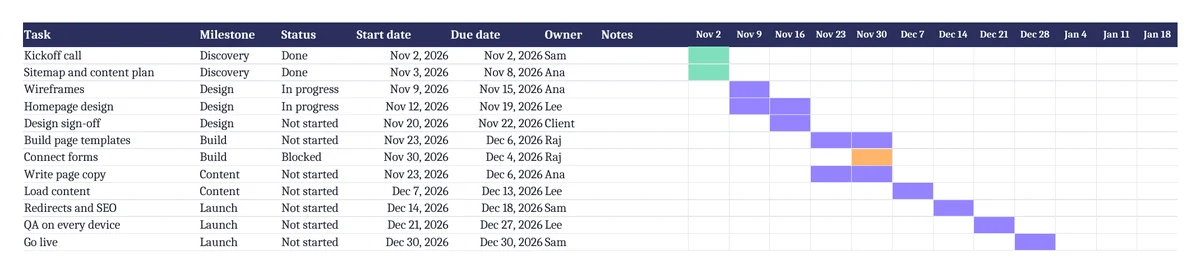
Columns for task, milestone, status, start date, due date, owner and notes, a status drop-down, and a twelve-week grid. Bars are purple for planned or in progress, green for done and orange for blocked.
Two ways to build a Gantt chart in Excel
Conditional formatting (what the template uses)
Put week-start dates across row 1 from column H, select the grid below, choose Home → Conditional Formatting → New Rule → Use a formula and enter =AND(H$1<=$E2, H$1+6>=$D2), where D is the start date and E the due date. Pick a fill colour. Add rules above it for done and blocked tasks.
Stacked bar chart
- Add a duration column (end date minus start date) next to your start dates.
- Insert a stacked bar chart from the task, start and duration columns (Insert → Bar → Stacked Bar).
- Hide the start series: click it and set Shape Fill to No Fill.
- Reverse the task order: format the vertical axis and tick Categories in reverse order.
Microsoft also offers free Gantt and project tracker templates. None of these methods handle dependencies or scheduling for you; for that you need a project tool.
Sharing an Excel tracker with clients
| Option | Client needs an account | What the client sees |
|---|---|---|
| Email the file | No | A copy that’s out of date as soon as it’s sent |
| OneDrive or SharePoint “Anyone with the link” | No | The live workbook, every sheet and column. Links can be forwarded, and admins can turn this option off. |
| Live Waypoint link | No | Progress, milestones and blockers, with task names and dates only if you choose. Owners and notes are never shown. |
Turn an Excel tracker into a live client view
- Export from Excel. Save the workbook as .xlsx (or CSV). Waypoint reads Excel files directly, picks the first sheet with a header row, and lets you switch sheets.
- Upload it to Waypoint. Start a journey, choose Upload a file and drop in the export. Waypoint finds the task, status, due date and owner columns, suggests your milestone or phase column for the stops along the route, and maps statuses like “In progress”, “On hold” and “Complete” to four states: not started, in progress, blocked and done. A live preview updates as you adjust.
- Name the destination. The outcome your client cares about, like “Checkout 2.0 live for every customer”, and the target date.
- Choose what clients see, then share the link. Stop names, task names and dates are each on or off. Owners and internal notes are never shown. Clients open the link in any browser, with no account, and tap a stop to see its tasks.
- Keep it current. Upload a fresh export to the same journey (journey settings → Change source or columns); Waypoint remembers your columns and the link stays the same. Or keep the tasks in a Google Sheet: Waypoint re-checks a shared sheet every 15 minutes, so the journey moves on its own.

Frequently asked questions
Does Excel have a Gantt chart?
Not as a chart type. Use a stacked bar chart, conditional formatting over a date grid, or a template like the one on this page.
Is this Excel project tracker template free?
Yes. Download it, change the sample tasks and dates, and the Gantt bars update themselves. It also opens in Google Sheets.
How do I share an Excel tracker without sending the file?
Store it in OneDrive or SharePoint and share a view-only link, or upload it to Waypoint and send a live link that shows progress without the spreadsheet.
Can Waypoint read Excel files?
Yes. Upload an .xlsx or CSV file. Waypoint finds the header row, maps your columns and statuses, and keeps the same link when you upload a newer version.