Short answer: Google Sheets has no built-in Gantt chart type. Use Timeline view (Insert → Timeline, on paid Google Workspace plans), a SPARKLINE bar formula, or conditional formatting across a row of dates. The free Gantt chart template below uses conditional formatting. To show clients progress, connect the same sheet to Waypoint and share a live link that updates every 15 minutes.
Free Gantt chart template
One row per task with a milestone, status, start date and due date. The weekly grid colours itself: purple for planned or in progress, green for done and orange for blocked.
In Google Sheets, choose File → Import → Upload and pick the file. It also opens in Excel. Waypoint imports it as it is, with milestones as stops.
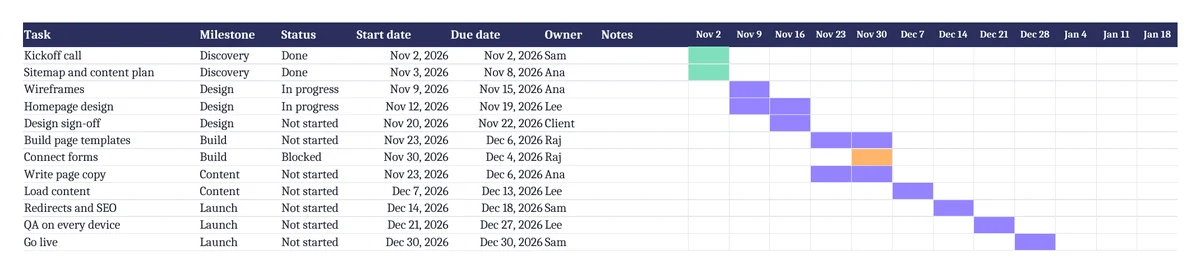
Three ways to make a Gantt chart in Google Sheets
1. Timeline view
Select your task table, then Insert → Timeline. You need at least one date column, and each start date must be before its end date. Timeline view is available on paid Google Workspace plans, not on personal Gmail accounts.
2. A SPARKLINE bar per task
With task names in column A, start dates in B and end dates in C (rows 2 to 20), put this in D2 and fill it down. The white part of each bar is the gap before the task starts; the coloured part is the task.
=SPARKLINE({B2-MIN($B$2:$B$20), C2-B2+1}, {"charttype","bar"; "color1","white"; "color2","#7b61ff"; "max", MAX($C$2:$C$20)-MIN($B$2:$B$20)+1})Make column D wide so the bars have room. The max option keeps every bar on the same scale.
3. Conditional formatting over a row of dates
Put one date per day across row 1 (for example from E1). Select the grid below them, open Format → Conditional formatting, choose Custom formula is and enter =AND(E$1>=$B2, E$1<=$C2), then pick a fill colour. The template works the same way with one column per week.
Sharing a Google Sheets Gantt chart with clients
| Option | Client needs an account | What the client sees |
|---|---|---|
| Anyone with the link, as viewer | No | The whole spreadsheet, including other tabs, and your name and email. They can download and copy it unless you turn that off. |
| Publish to the web | No | A public web page of the sheet or chosen tabs, updated a few minutes after edits |
| Live Waypoint link | No | Progress, milestones and blockers, with task names and dates only if you choose. Owners and notes are never shown. |
A shared sheet is honest and quick, but clients still have to read a grid. Notes, owners and half-finished rows come along unless you keep a separate copy, and that copy drifts.
Turn the sheet into a live client view
- Share the sheet as “Anyone with the link can view”. Waypoint only reads it.
- Paste the link into Waypoint. Start a journey and choose Google Sheets. Waypoint finds your task, status, milestone, due date and owner columns, and you confirm them in a live preview.
- Name the destination and the target date.
- Choose what clients see and share the link. Clients open it in any browser, with no account.
- Keep working in the sheet. Waypoint checks it every 15 minutes (or press Sync now), and the journey moves when a status changes.

Prefer a plain tracker without the Gantt grid? Use the Google Sheets project tracker template.
Frequently asked questions
Does Google Sheets have a Gantt chart?
Not as a chart type. Timeline view (paid Google Workspace plans) is the closest built-in option. Otherwise use a SPARKLINE bar formula or conditional formatting across a row of dates.
Is there a free Gantt chart template for Google Sheets?
Yes. Download the template on this page and open it in Google Sheets with File → Import. Its bars come from conditional formatting, so they update when you change a date or status.
Can I use Timeline view with a personal Gmail account?
No. Timeline view is available on paid Google Workspace editions, not on personal Google accounts.
How do I share a Google Sheets Gantt chart with a client?
Share it as “Anyone with the link can view”, or publish it to the web. For a cleaner view that hides owners and notes, connect the sheet to Waypoint and send the live link instead.
How often does Waypoint update from Google Sheets?
Every 15 minutes, and right away when you press Sync now.